Institutional Holdings: Analyze Hedge Fund Portfolios with Python
Every quarter, institutional investment managers with over $100 million in assets must disclose their equity holdings to the SEC via 13F filings. EdgarTools parses these filings into structured Python objects, giving you a window into what the biggest funds are buying and selling -- in a few lines of code.
from edgar import Company

berkshire = Company("BRK.A")
report = berkshire.get_filings(form="13F-HR")[0].obj()
report
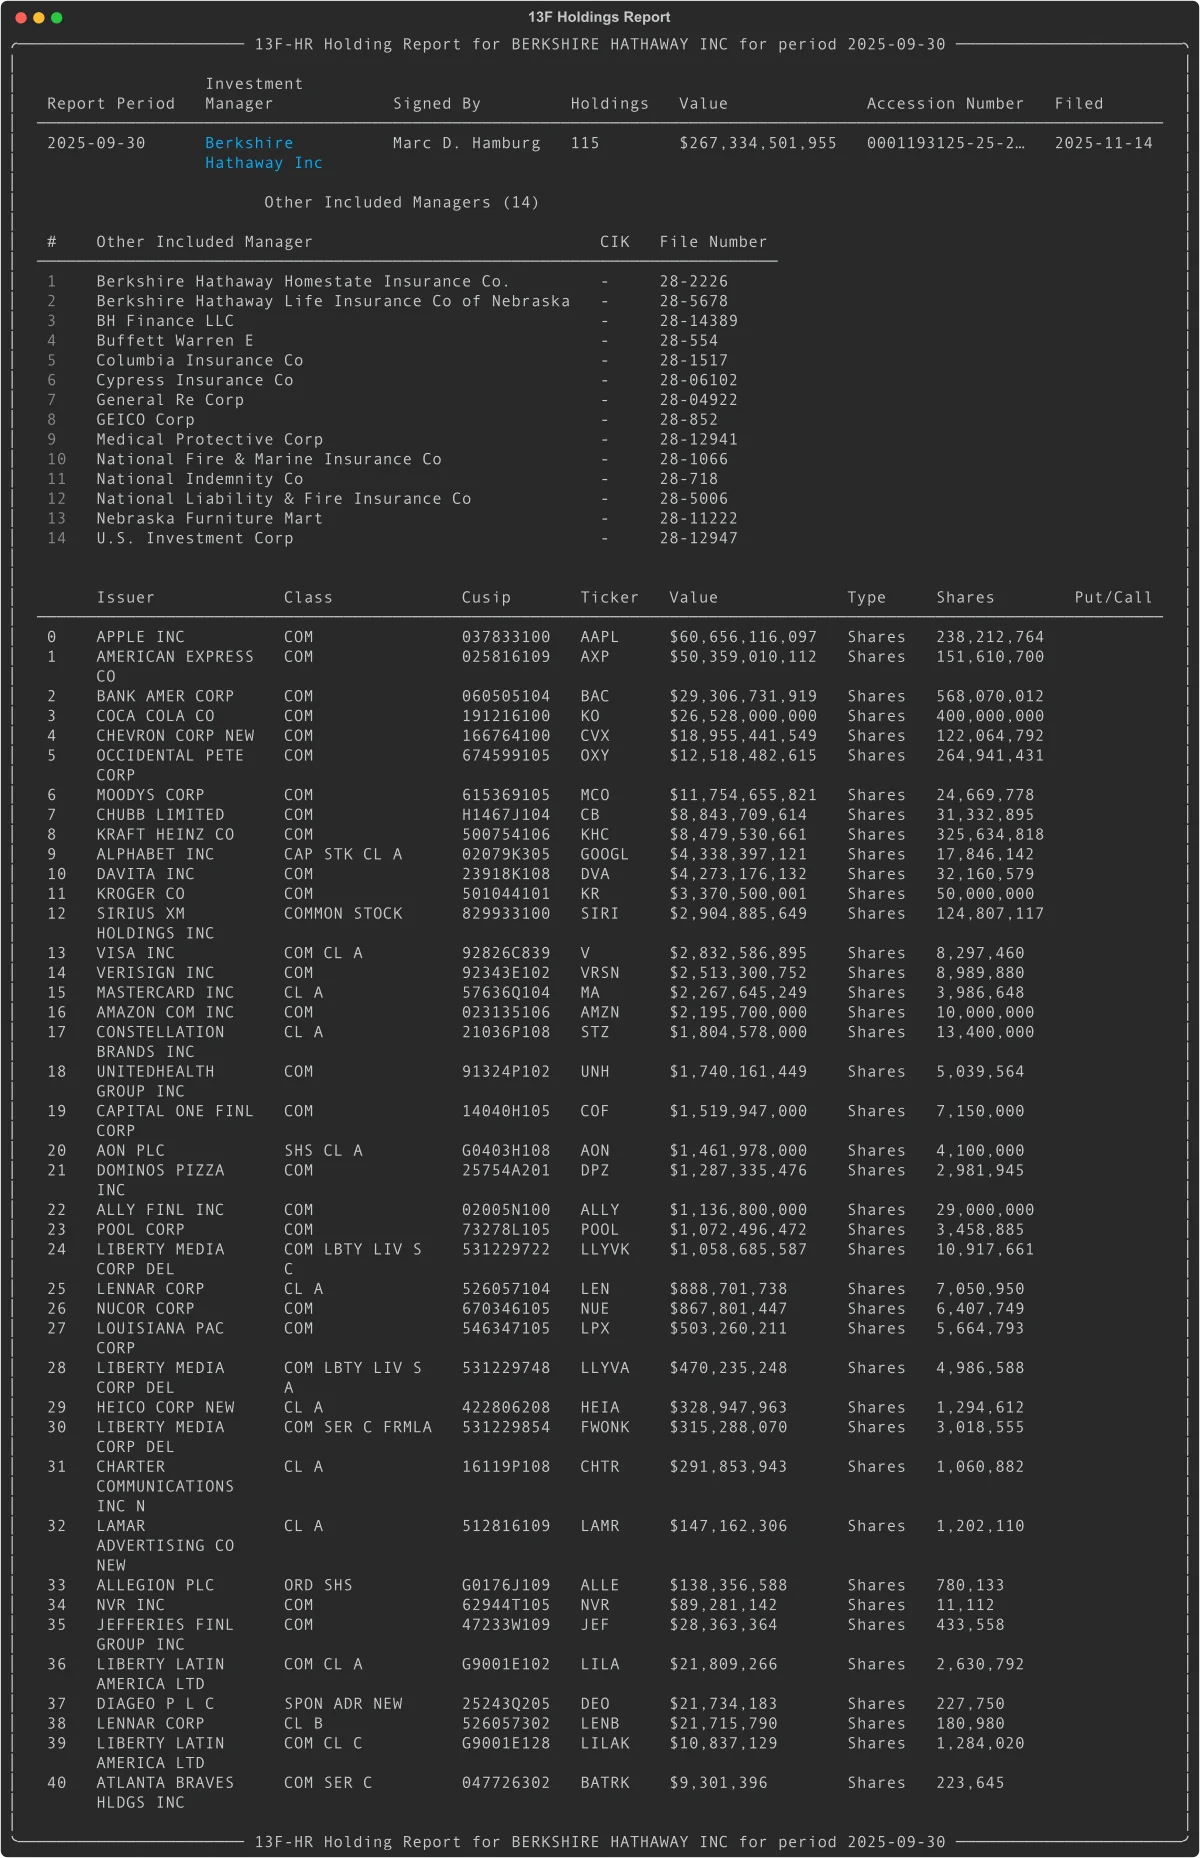
One call to filing.obj() and you get a fully parsed report: the investment manager, total portfolio value, every position, and the subsidiary managers involved.
Find 13F Filings
Search by Fund
If you know the fund's ticker or name, start with Company:
from edgar import Company

# By ticker
berkshire = Company("BRK.A")
filings = berkshire.get_filings(form="13F-HR")

# Latest filing
report = filings[0].obj()
print(report.management_company_name)  # "Berkshire Hathaway Inc"
print(f"${report.total_value:,} across {report.total_holdings} holdings")
Search Across All Filers
To browse 13F filings market-wide, use get_filings:
from edgar import get_filings

# All 13F holdings reports filed in Q3 2024
filings = get_filings(form="13F-HR", year=2024, quarter=3)

# Filter to a specific date range
filings = get_filings(
    form="13F-HR",
    filing_date="2024-11-01:2024-11-15"
)
Access Holdings Data
The .holdings property returns a pandas DataFrame with one row per security, sorted by value:
report.holdings_view()
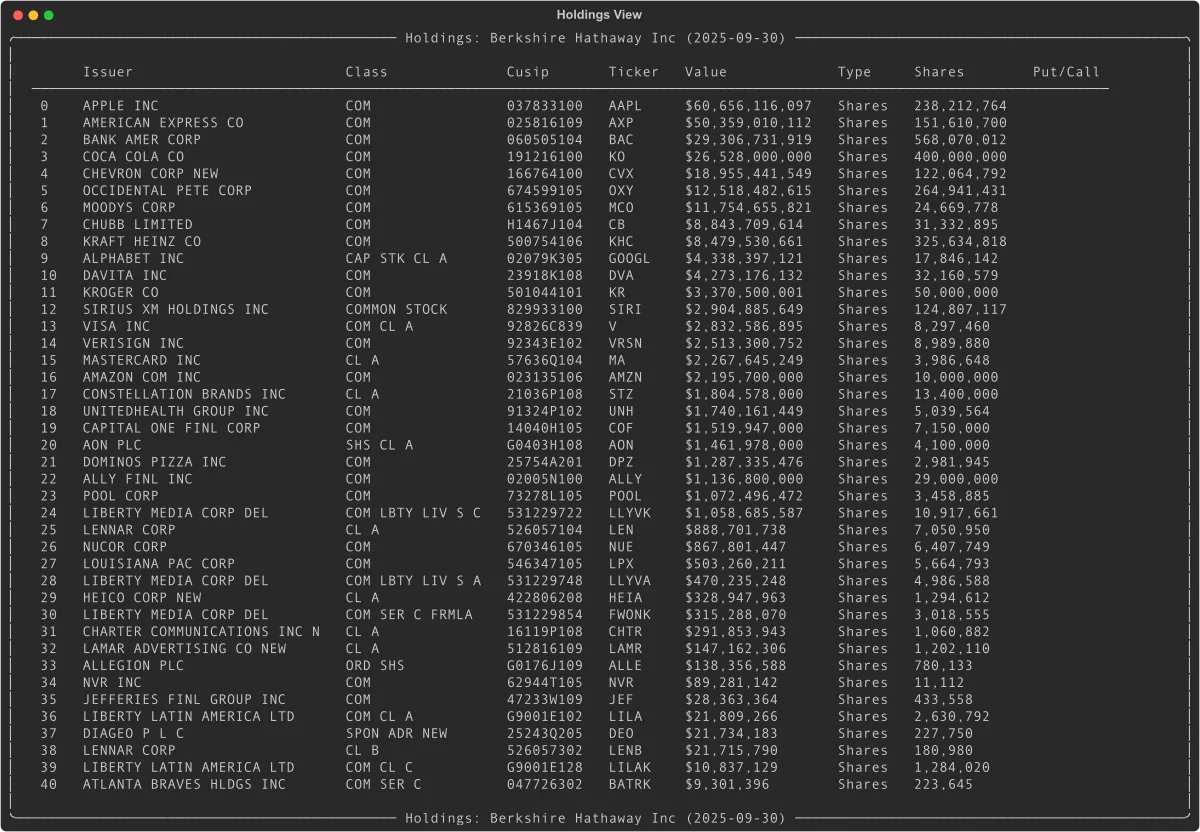
Every position includes the issuer name, resolved ticker symbol, CUSIP, market value, share count, and voting authority breakdown.
Key Columns
| Column | What it is |
|---|---|
Issuer |
Company name ("APPLE INC") |
Ticker |
Resolved ticker symbol ("AAPL") |
Value |
Market value in thousands of dollars |
SharesPrnAmount |
Share count or principal amount |
Cusip |
9-character CUSIP |
Type |
"Shares" or "Principal" |
PutCall |
"PUT", "CALL", or empty |
Values are in thousands -- the SEC's reporting unit. A Value of 60,656,116 means approximately $60.7 billion.
Work with the DataFrame Directly
h = report.holdings

# Top 5 positions
h.head(5)

# Filter by ticker
apple = h[h['Ticker'] == 'AAPL']

# Total portfolio value in dollars
total = h['Value'].sum() * 1000
Compare Holdings Quarter-over-Quarter
One call to see what changed since last quarter:
report.compare_holdings()
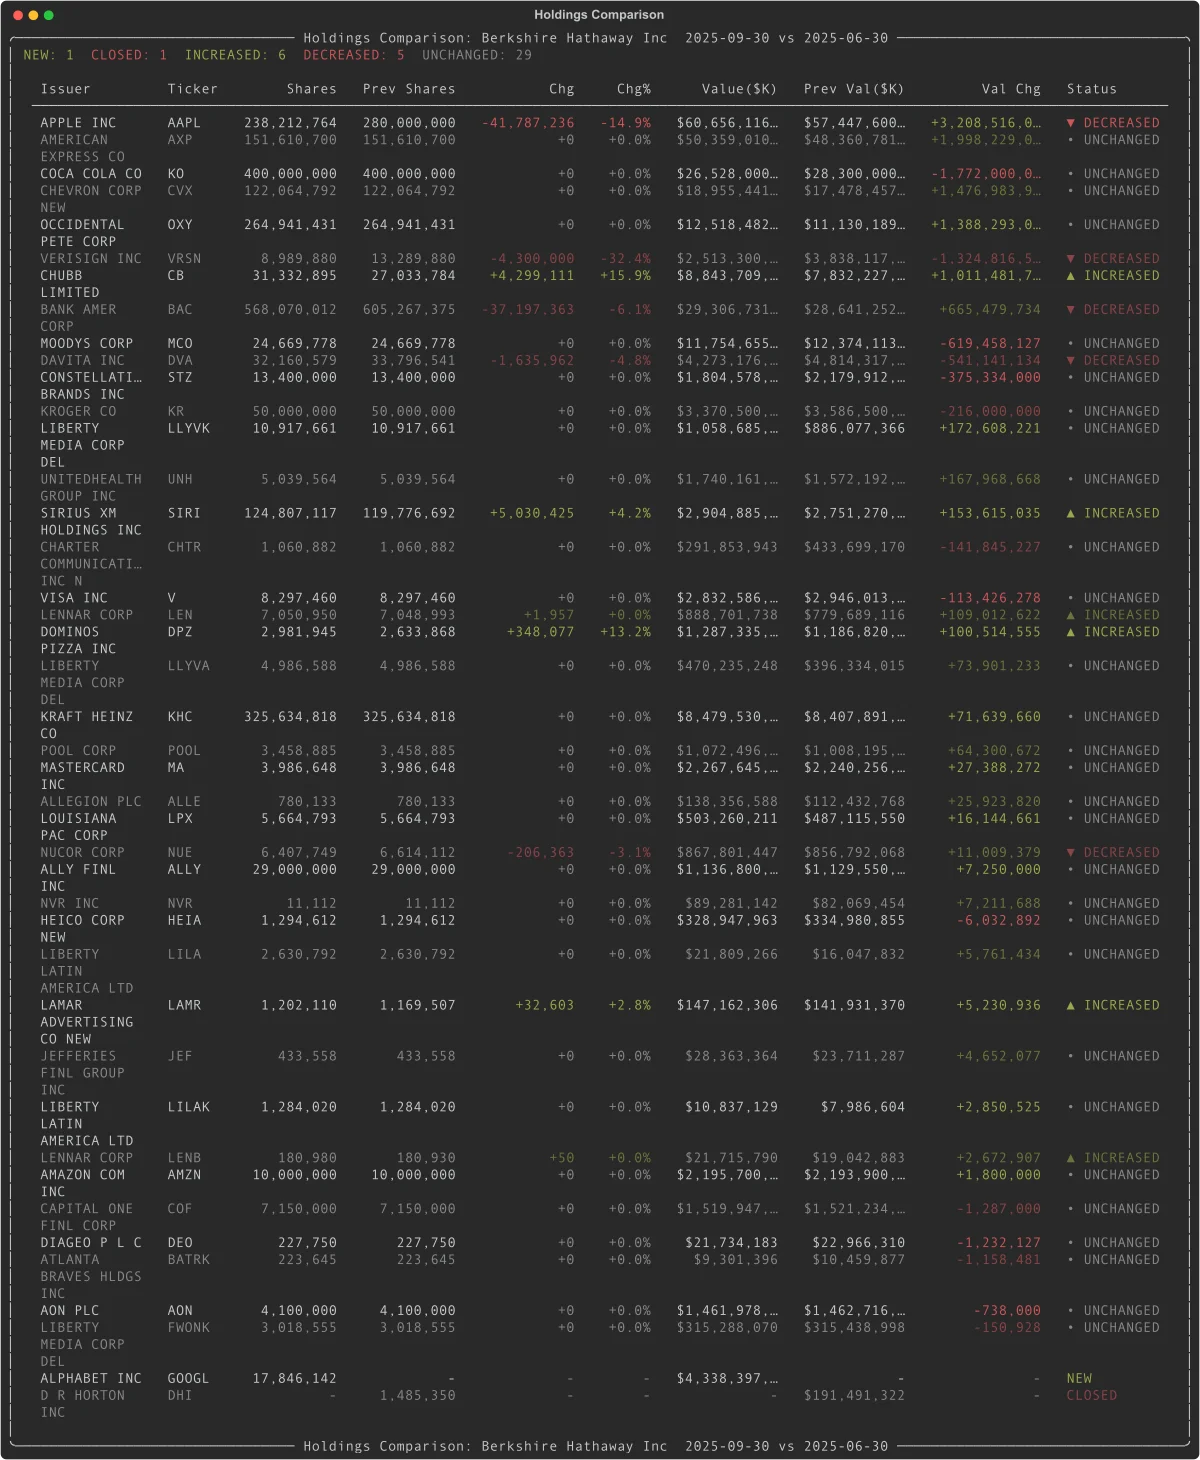
Every position gets a status: NEW, CLOSED, INCREASED, DECREASED, or UNCHANGED. Results are sorted by absolute value change so the biggest moves appear first.
Dig into the Comparison Data
comparison = report.compare_holdings()
df = comparison.data

# New buys this quarter
new_buys = df[df['Status'] == 'NEW']

# Positions that were sold entirely
exits = df[df['Status'] == 'CLOSED']

# Positions where shares increased
increases = df[df['Status'] == 'INCREASED']
The comparison DataFrame includes Shares, PrevShares, ShareChange, ShareChangePct, Value, PrevValue, ValueChange, ValueChangePct, and Status.
Track Holdings Trends Across Quarters
See how positions evolve over multiple quarters with sparkline visualizations:
history = report.holding_history(periods=4)
history
Each row shows share counts per quarter and a Unicode sparkline so you can spot trends at a glance. Access the underlying data with history.data.
Analyze Portfolio Concentration
h = report.holdings
total = h['Value'].sum()
h['Weight'] = (h['Value'] / total * 100).round(2)

# Top 10 holdings by portfolio weight
h[['Ticker', 'Issuer', 'Value', 'Weight']].head(10)
Find Options Positions
options = report.holdings.query("PutCall in ['PUT', 'CALL']")
puts = options.query("PutCall == 'PUT'")
calls = options.query("PutCall == 'CALL'")
Access the Previous Quarter
previous = report.previous_holding_report()  # Returns a ThirteenF or None
if previous:
    print(f"Previous period: {previous.report_period}")
    print(f"Previous holdings: {previous.total_holdings}")
Understand Multi-Manager Filings
Large institutions like Berkshire Hathaway file consolidated 13F reports covering multiple subsidiary managers. The .holdings property automatically aggregates across all managers. If you need per-manager detail, use .infotable instead:
report.infotable    # Disaggregated: one row per manager-security pair
report.holdings     # Aggregated: one row per security (recommended)

# See who the other managers are
for mgr in report.other_managers:
    print(f"{mgr.name} (File: {mgr.file_number})")
Use View Objects in Your Own App
holdings_view(), compare_holdings(), and holding_history() all return view objects. They render beautifully in the terminal via Rich, but also support iteration, indexing, and direct DataFrame access:
view = report.holdings_view()

# Iterate rows as dicts
for row in view:
    print(row['Ticker'], row['Value'])

# Index a single row
view[0]

# Slice (returns DataFrame)
view[:10]

# Access the full DataFrame
view.data
Things to Know
Values are in thousands. The SEC requires 13F values in $000s. A Value of 135,364 means $135.4 million.
holdings vs infotable. Use holdings (aggregated by CUSIP) for portfolio analysis. Use infotable only when you need per-manager detail in multi-manager filings.
Ticker resolution. Tickers are resolved from CUSIPs. Most resolve correctly, but delisted or obscure securities may show as blank.
13F-NT means no holdings. Notice filings indicate the manager had nothing to report. Check with report.has_infotable().
Report period vs filing date. The report_period is the quarter end (e.g., 2025-09-30). The filing_date can be up to 45 days later.
Historical filings work too. 13F filings before Q3 2013 used fixed-width TXT format instead of XML. EdgarTools parses both transparently -- the same filing.obj() call works for filings back to 2005. The TXT parser handles spaced CUSIPs, multi-line company names, paginated tables, and multi-manager continuation rows. About 93% of TXT-era filings parse successfully; a small number with unusual formatting may return an empty infotable.
Related
- 13F Data Object Guide -- complete property and method reference for
ThirteenFobjects - Working with Filings -- general filing access patterns