13F Holdings: Parse SEC Institutional Portfolio Filings with Python
See what the big funds are buying. SEC 13F filings disclose the equity holdings of institutional managers with over $100M in assets -- every quarter, publicly available. EdgarTools parses these filings into structured Python objects so you can analyze portfolios in a few lines of code.
from edgar import get_filings

filings = get_filings(form="13F-HR")
report = filings[0].obj()
report
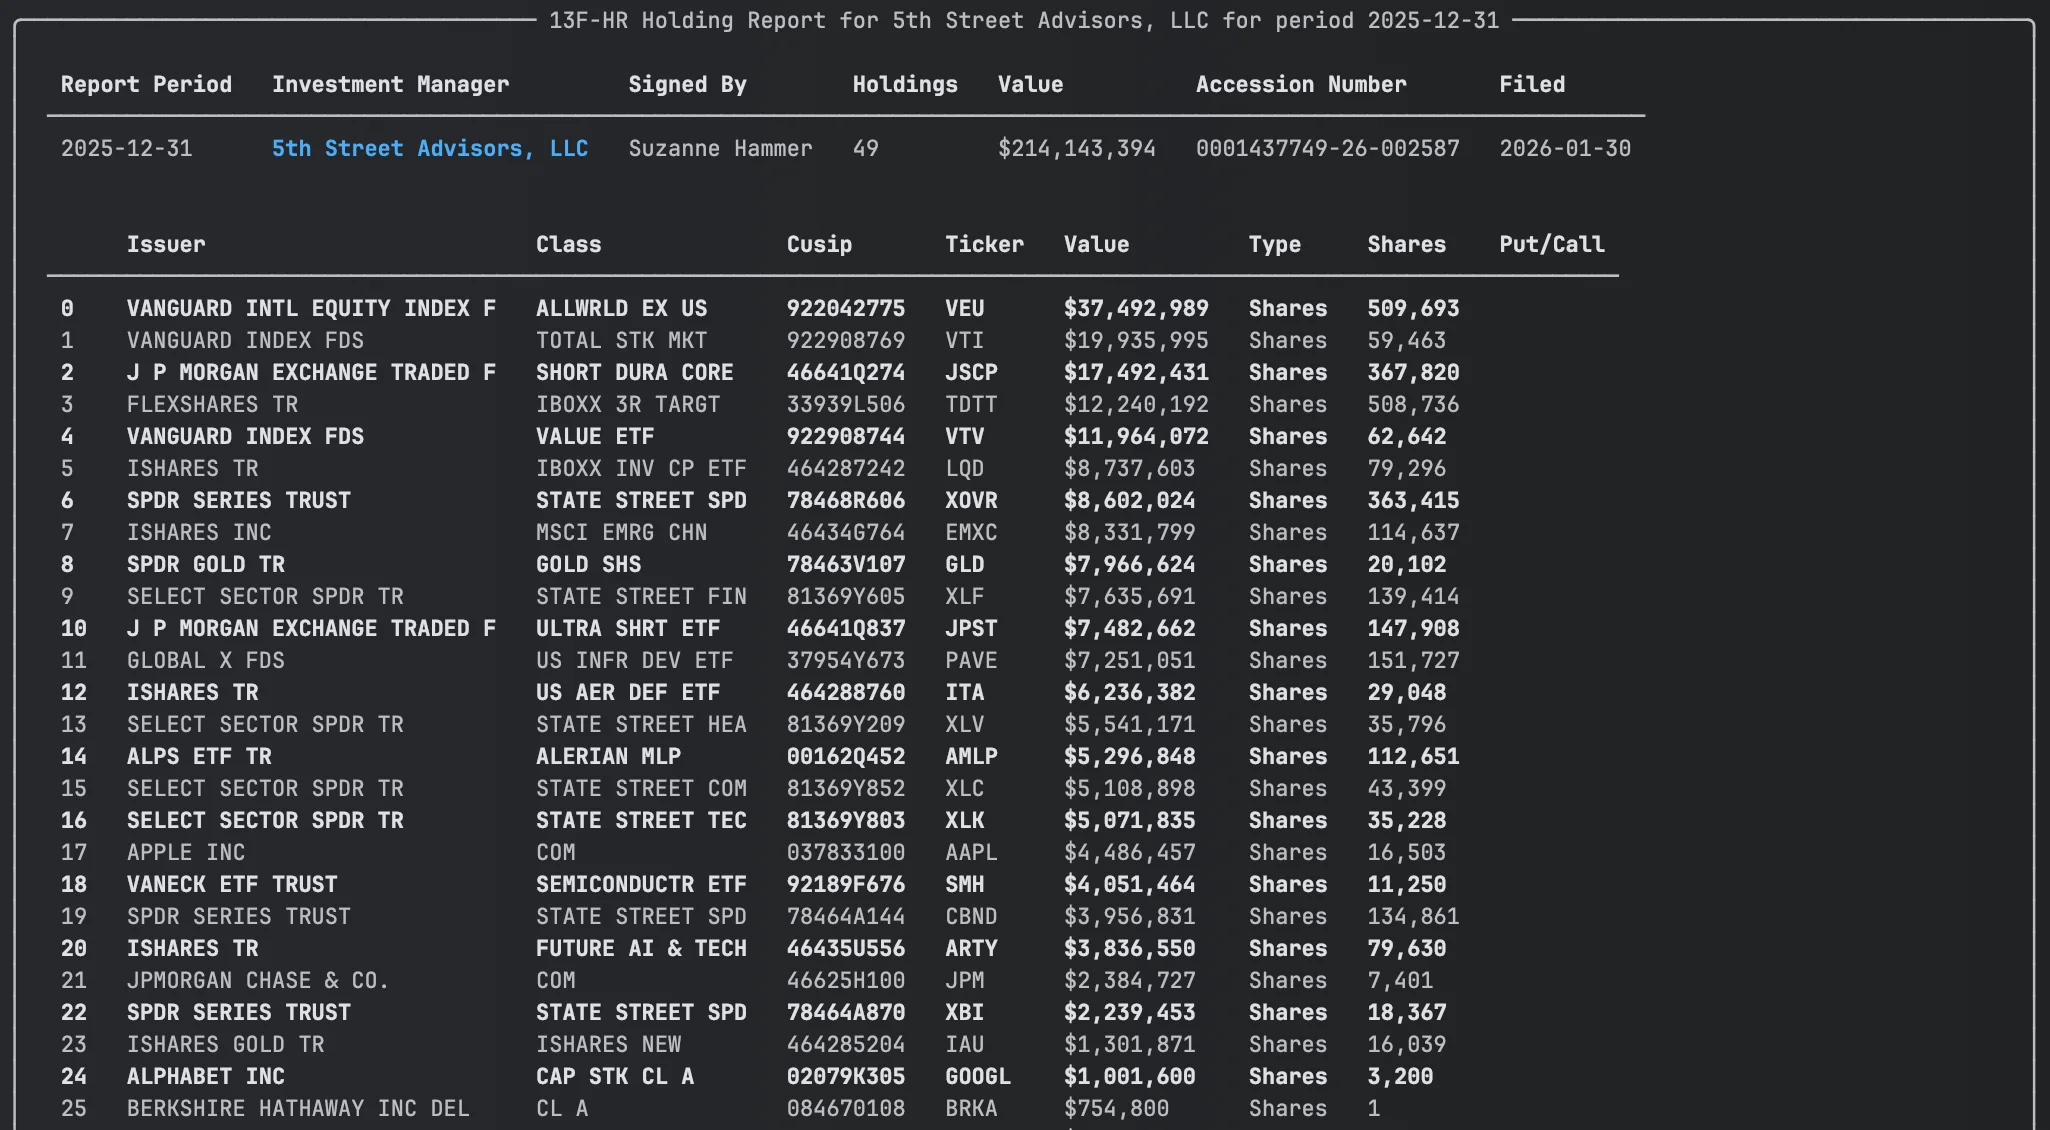
Three lines to get a fully parsed holdings report with management company, total portfolio value, and every position.
Access Holdings Data
The .holdings property returns a DataFrame with one row per security, aggregated across managers, sorted by value:
report.holdings
| Column | What it is |
|---|---|
Issuer |
Company name ("APPLE INC") |
Ticker |
Resolved ticker symbol ("AAPL") |
Value |
Market value in thousands of dollars |
SharesPrnAmount |
Share count or principal amount |
Cusip |
9-character CUSIP |
Type |
"Shares" or "Principal" |
PutCall |
"PUT", "CALL", or empty |
Values are in thousands -- the SEC's reporting unit. Value of 135,364 means $135.4 million.
Compare 13F Holdings Quarter-over-Quarter
One call to see what changed:
report.compare_holdings()
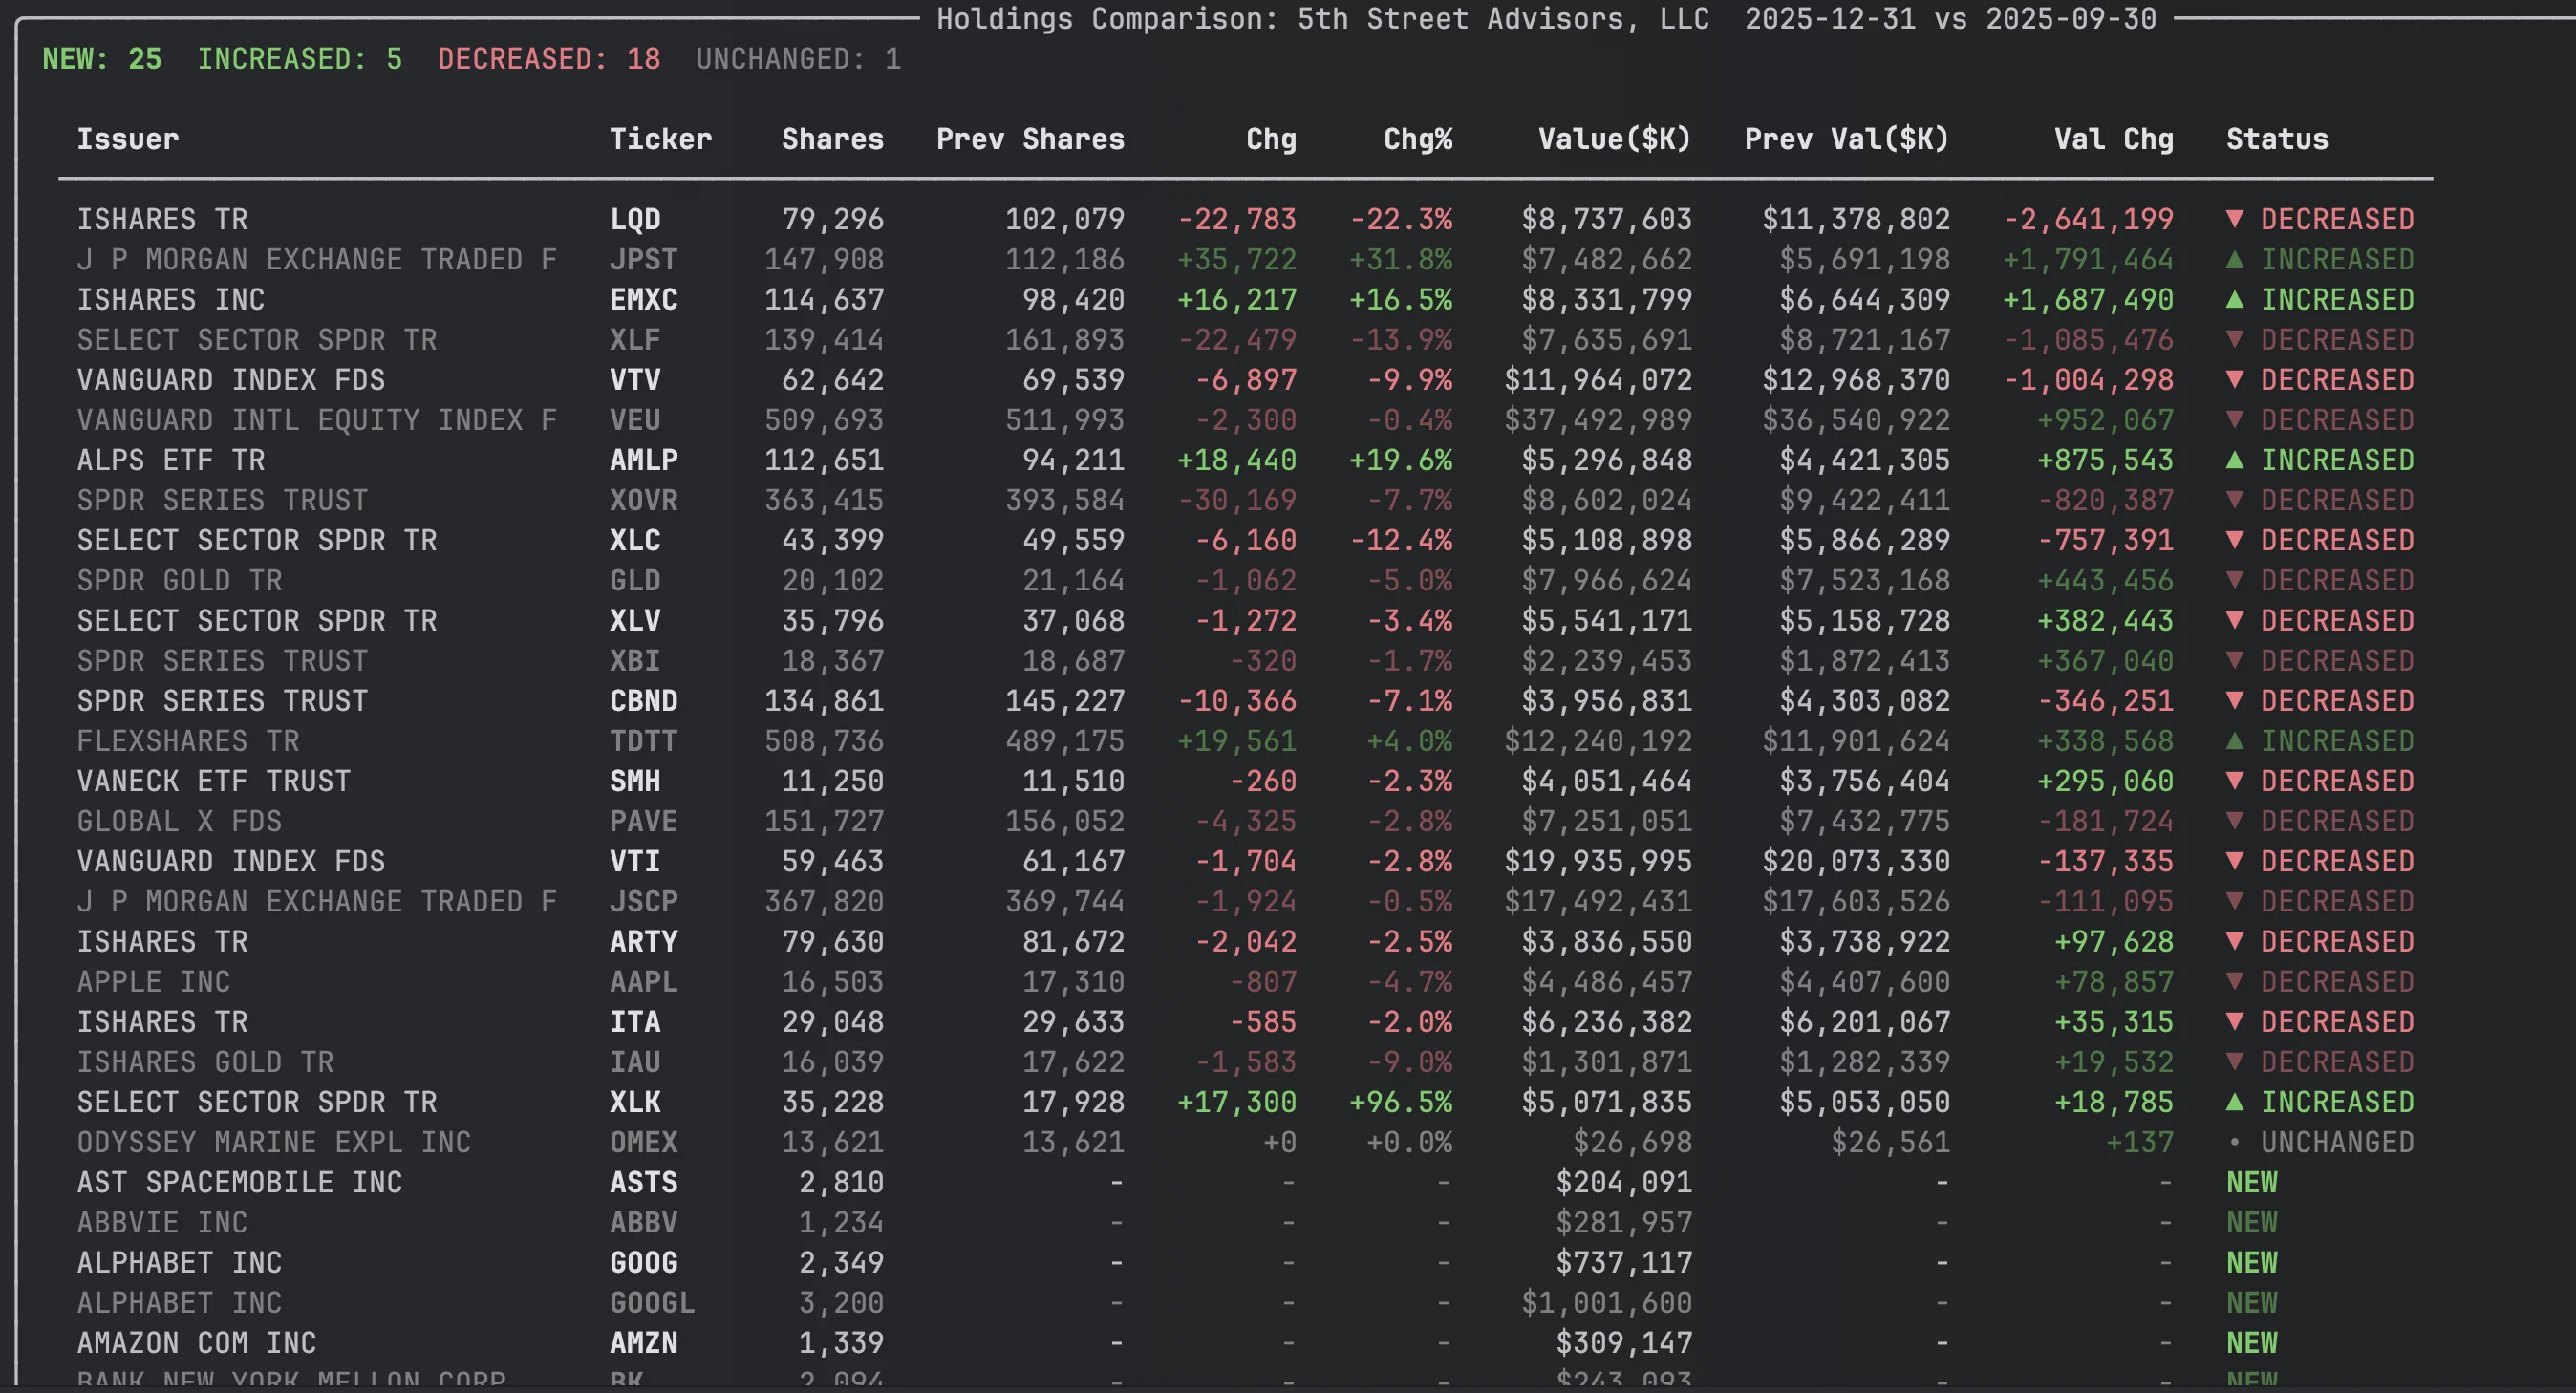
Every position gets a status: NEW, CLOSED, INCREASED, DECREASED, or UNCHANGED. Results are sorted by absolute value change so the biggest moves appear first.
comparison = report.compare_holdings()

# Dig into the data
df = comparison.data
new_buys = df[df['Status'] == 'NEW']
exits = df[df['Status'] == 'CLOSED']
The comparison DataFrame includes Shares, PrevShares, ShareChange, ShareChangePct, Value, PrevValue, ValueChange, ValueChangePct, and Status.
Track Holdings Trends Across Quarters
See how positions evolve across quarters with sparkline visualizations:
report.holding_history(periods=4)
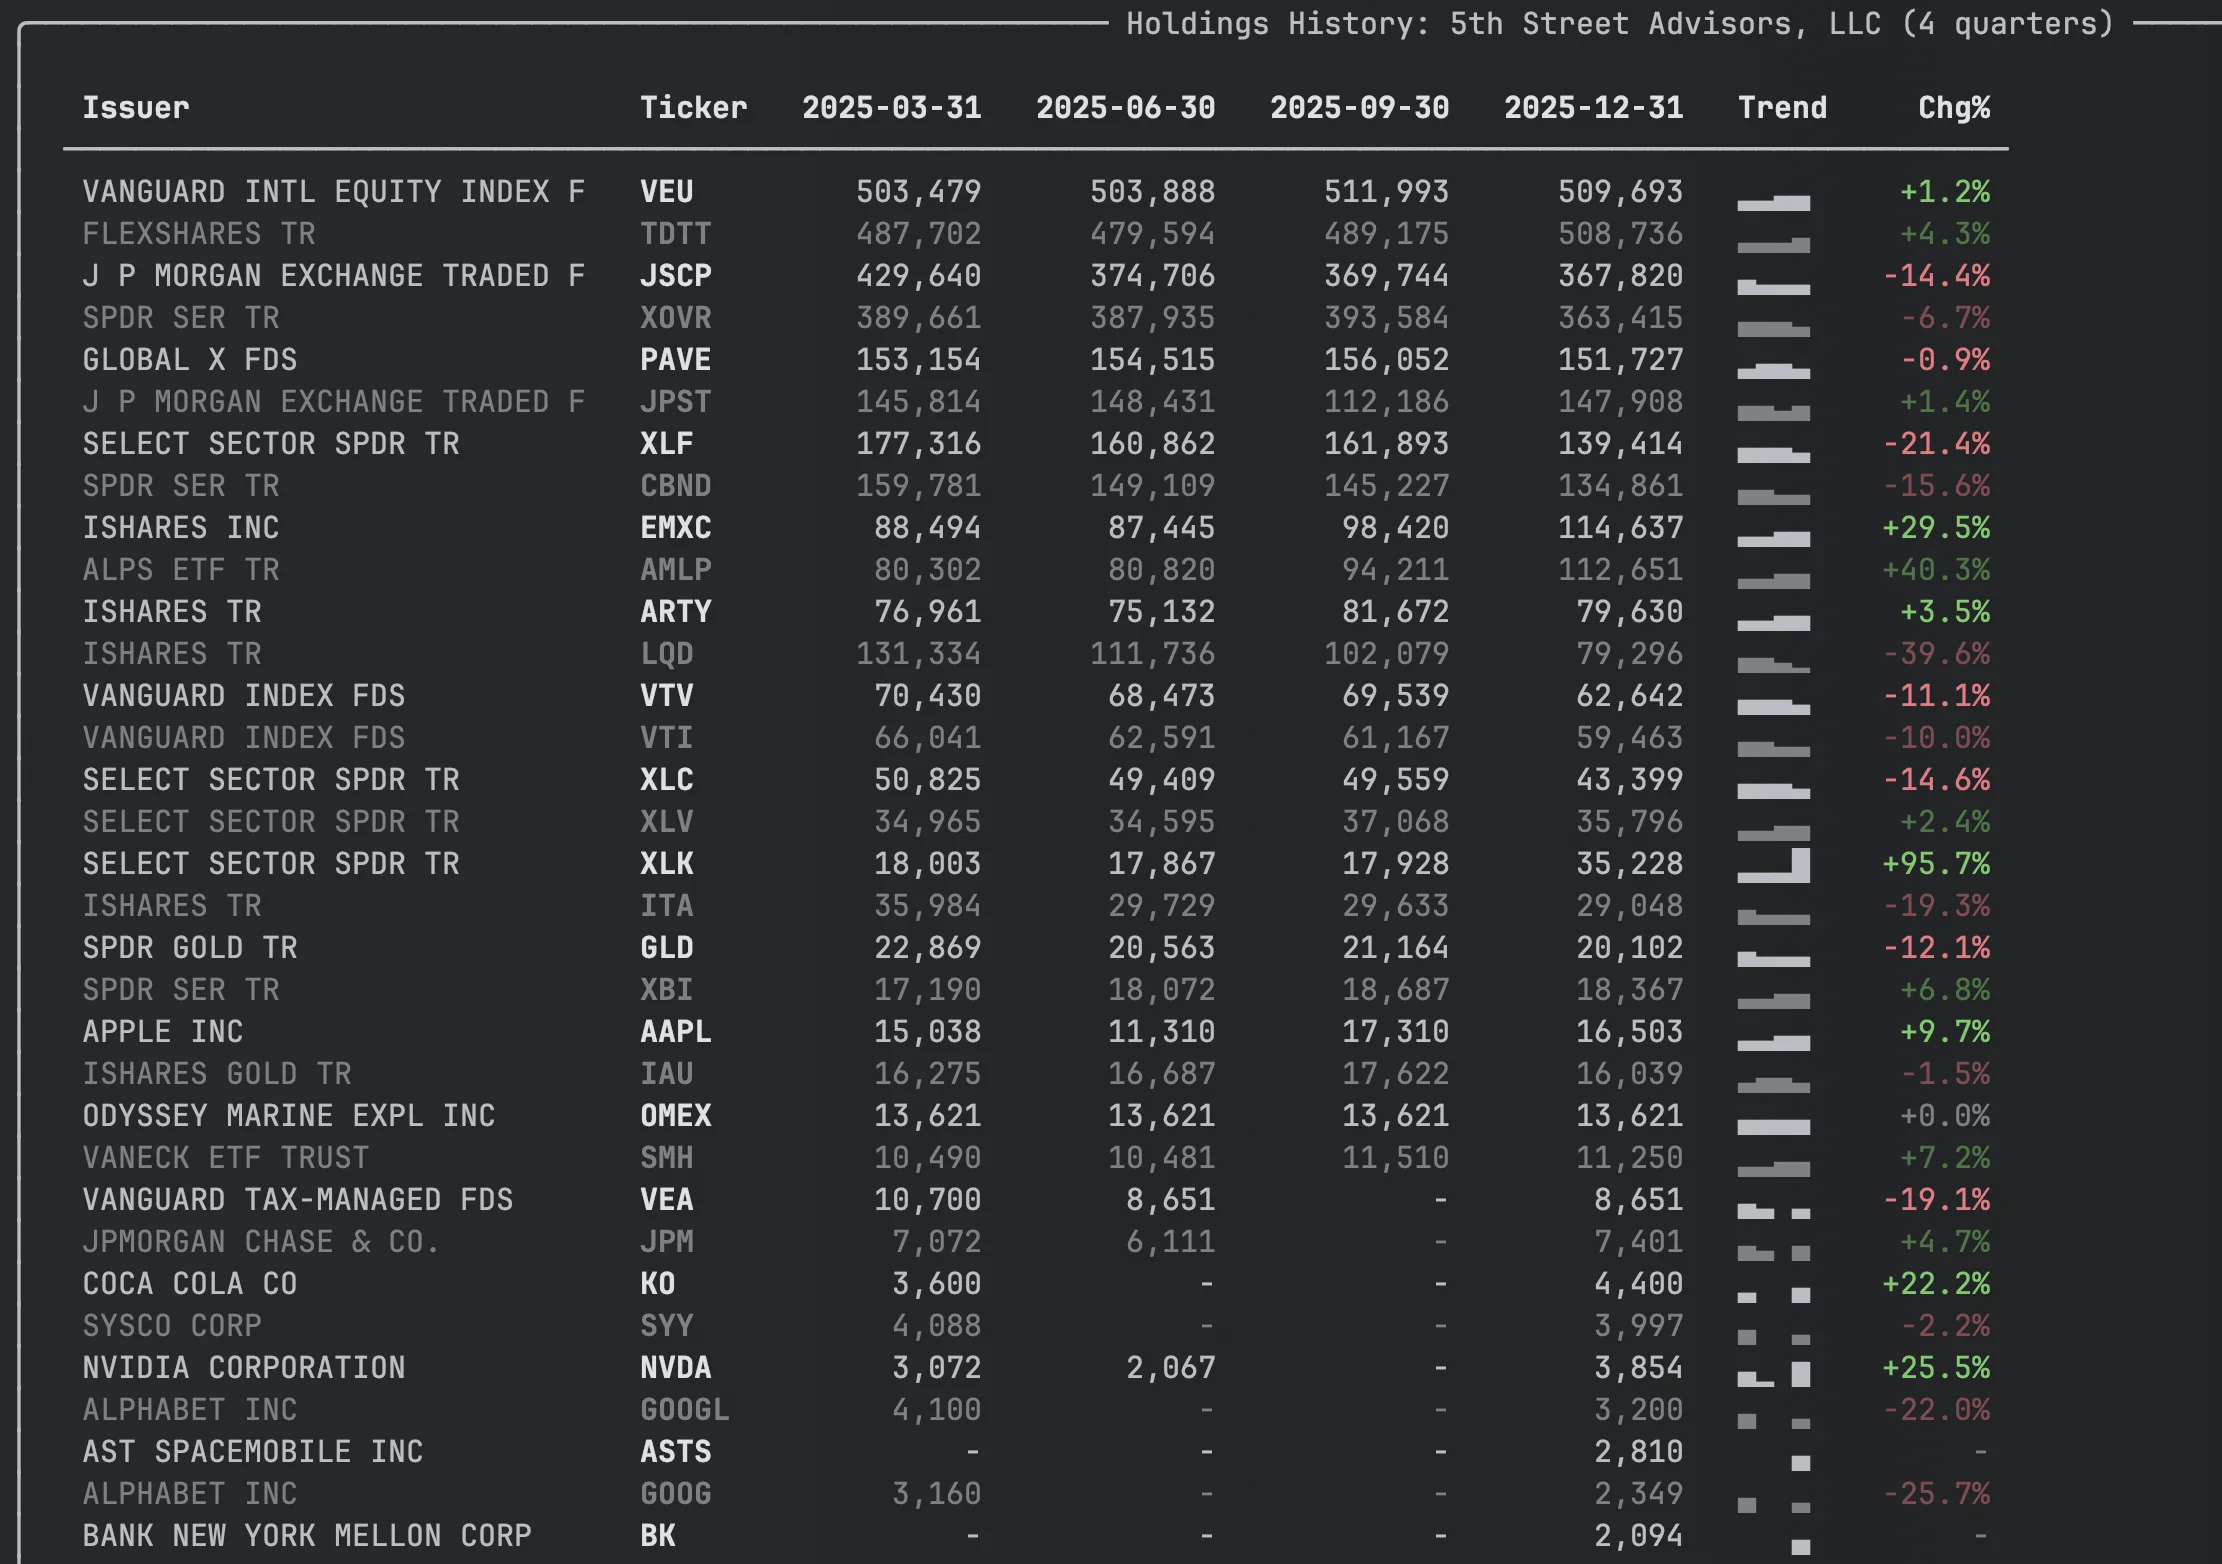
Each row shows share counts per quarter and a Unicode sparkline (▁▂▃▅▇) so you can spot trends at a glance.
history = report.holding_history(periods=4)
df = history.data  # Full DataFrame with one column per quarter
Using View Objects in Your Own App
holdings_view(), compare_holdings(), and holding_history() all return view objects that render in the terminal via Rich but also support iteration, indexing, and access to the underlying DataFrame. This makes them useful for building your own dashboards, reports, or exports.
All three views share the same interface:
view = report.holdings_view()
comparison = report.compare_holdings()
history = report.holding_history(periods=4)

# Iterate rows as dicts
for row in view:
    print(row['Ticker'], row['Value'])

# Index a single row (returns dict)
view[0]

# Slice (returns DataFrame)
view[:10]

# Length
len(view)

# Access the full DataFrame directly
view.data
comparison.data
history.data
Each view also carries metadata useful for rendering headers:
| View | Metadata |
|---|---|
HoldingsView |
.display_limit |
HoldingsComparison |
.current_period, .previous_period, .manager_name |
HoldingsHistory |
.periods (list of quarter dates), .manager_name |
Look Up a Specific Fund
from edgar import Company

berkshire = Company("BRK.A")
filing = berkshire.get_filings(form="13F-HR").latest(1)
report = filing.obj()

print(report.management_company_name)  # "Berkshire Hathaway Inc"
print(f"${report.total_value:,}K across {report.total_holdings} holdings")
Common Analysis Patterns
Portfolio concentration
h = report.holdings
total = h['Value'].sum()
h['Weight'] = (h['Value'] / total * 100).round(2)
h[['Ticker', 'Issuer', 'Value', 'Weight']].head(10)
Options positions
report.holdings.query("PutCall in ['PUT', 'CALL']")
Previous quarter's full report
previous = report.previous_holding_report()  # Returns a ThirteenF or None
previous.holdings
Multi-Manager Filings
Large institutions (Bank of America, State Street) file consolidated 13F reports. The holdings property automatically aggregates across all managers. If you need per-manager detail, use infotable instead:
report.infotable   # Disaggregated: one row per manager-security pair
report.holdings    # Aggregated: one row per security (recommended)

# Example: Berkshire Hathaway
# infotable: ~121 rows (3 managers x ~40 securities)
# holdings:   ~40 rows (aggregated by CUSIP)

# See who the other managers are
for mgr in report.other_managers:
    print(f"{mgr.name} (CIK: {mgr.cik})")
Metadata Quick Reference
| Property | Returns | Example |
|---|---|---|
management_company_name |
Company that filed | "Berkshire Hathaway Inc" |
report_period |
Quarter end date | "2024-03-31" |
filing_date |
Date filed | "2024-05-15" |
total_value |
Portfolio value ($000s) | Decimal('313218000') |
total_holdings |
Number of positions | 40 |
filing_signer_name |
Who signed | "Marc D. Hamburg" |
filing_signer_title |
Signer's title | "Senior Vice President" |
form |
Form type | "13F-HR" |
accession_number |
SEC accession no. | "0000950123-24-007092" |
has_infotable() |
Has holdings data? | True for 13F-HR, False for 13F-NT |
Methods Quick Reference
| Call | Returns | What it does |
|---|---|---|
report.holdings |
DataFrame |
Aggregated holdings, one row per security |
report.infotable |
DataFrame |
Raw holdings, disaggregated by manager |
report.holdings_view() |
HoldingsView |
Rich-renderable, iterable holdings |
report.compare_holdings() |
HoldingsComparison |
Quarter-over-quarter changes with status labels |
report.holding_history(periods=4) |
HoldingsHistory |
Multi-quarter share trends with sparklines |
report.previous_holding_report() |
ThirteenF |
Previous quarter's 13F object |
report.other_managers |
list[OtherManager] |
Affiliated managers in consolidated filings |
report.get_portfolio_managers() |
list[dict] |
Curated lookup of known portfolio managers |
Things to Know
Values are in thousands. The SEC requires 13F values in $000s. A Value of 135,364 is $135.4 million.
holdings vs infotable. Use holdings (aggregated by CUSIP) for portfolio analysis. Use infotable only when you need per-manager detail in multi-manager filings.
Ticker resolution. Tickers are resolved from CUSIPs. Most resolve correctly, but delisted or obscure securities may show as blank.
Pre-2013 filings use TXT format. Before Q3 2013, 13F information tables were filed as fixed-width TXT rather than XML. EdgarTools parses both formats transparently -- filing.obj() returns the same ThirteenF object either way. The TXT parser handles spaced CUSIPs (025816 10 9), multi-line company names, multi-table paginated filings, and continuation rows for multi-manager assignments. Coverage across the 2005-2013 TXT era is ~93% of filings. The remaining ~7% are unusual formats (HTML tables, tab-delimited, non-standard layouts) that may return an empty infotable.
13F-NT means no holdings. Notice filings indicate the manager had nothing to report. has_infotable() returns False.
Report period vs filing date. The report_period is the quarter end. The filing_date can be up to 45 days later. Some managers file multiple historical periods on the same day.
Related
- Institutional Holdings Guide -- workflow-oriented guide for finding, analyzing, and comparing 13F holdings
- Working with Filings -- general filing access patterns